This dashboard provides an interactive overview of NBA player visualizations and a summary table.
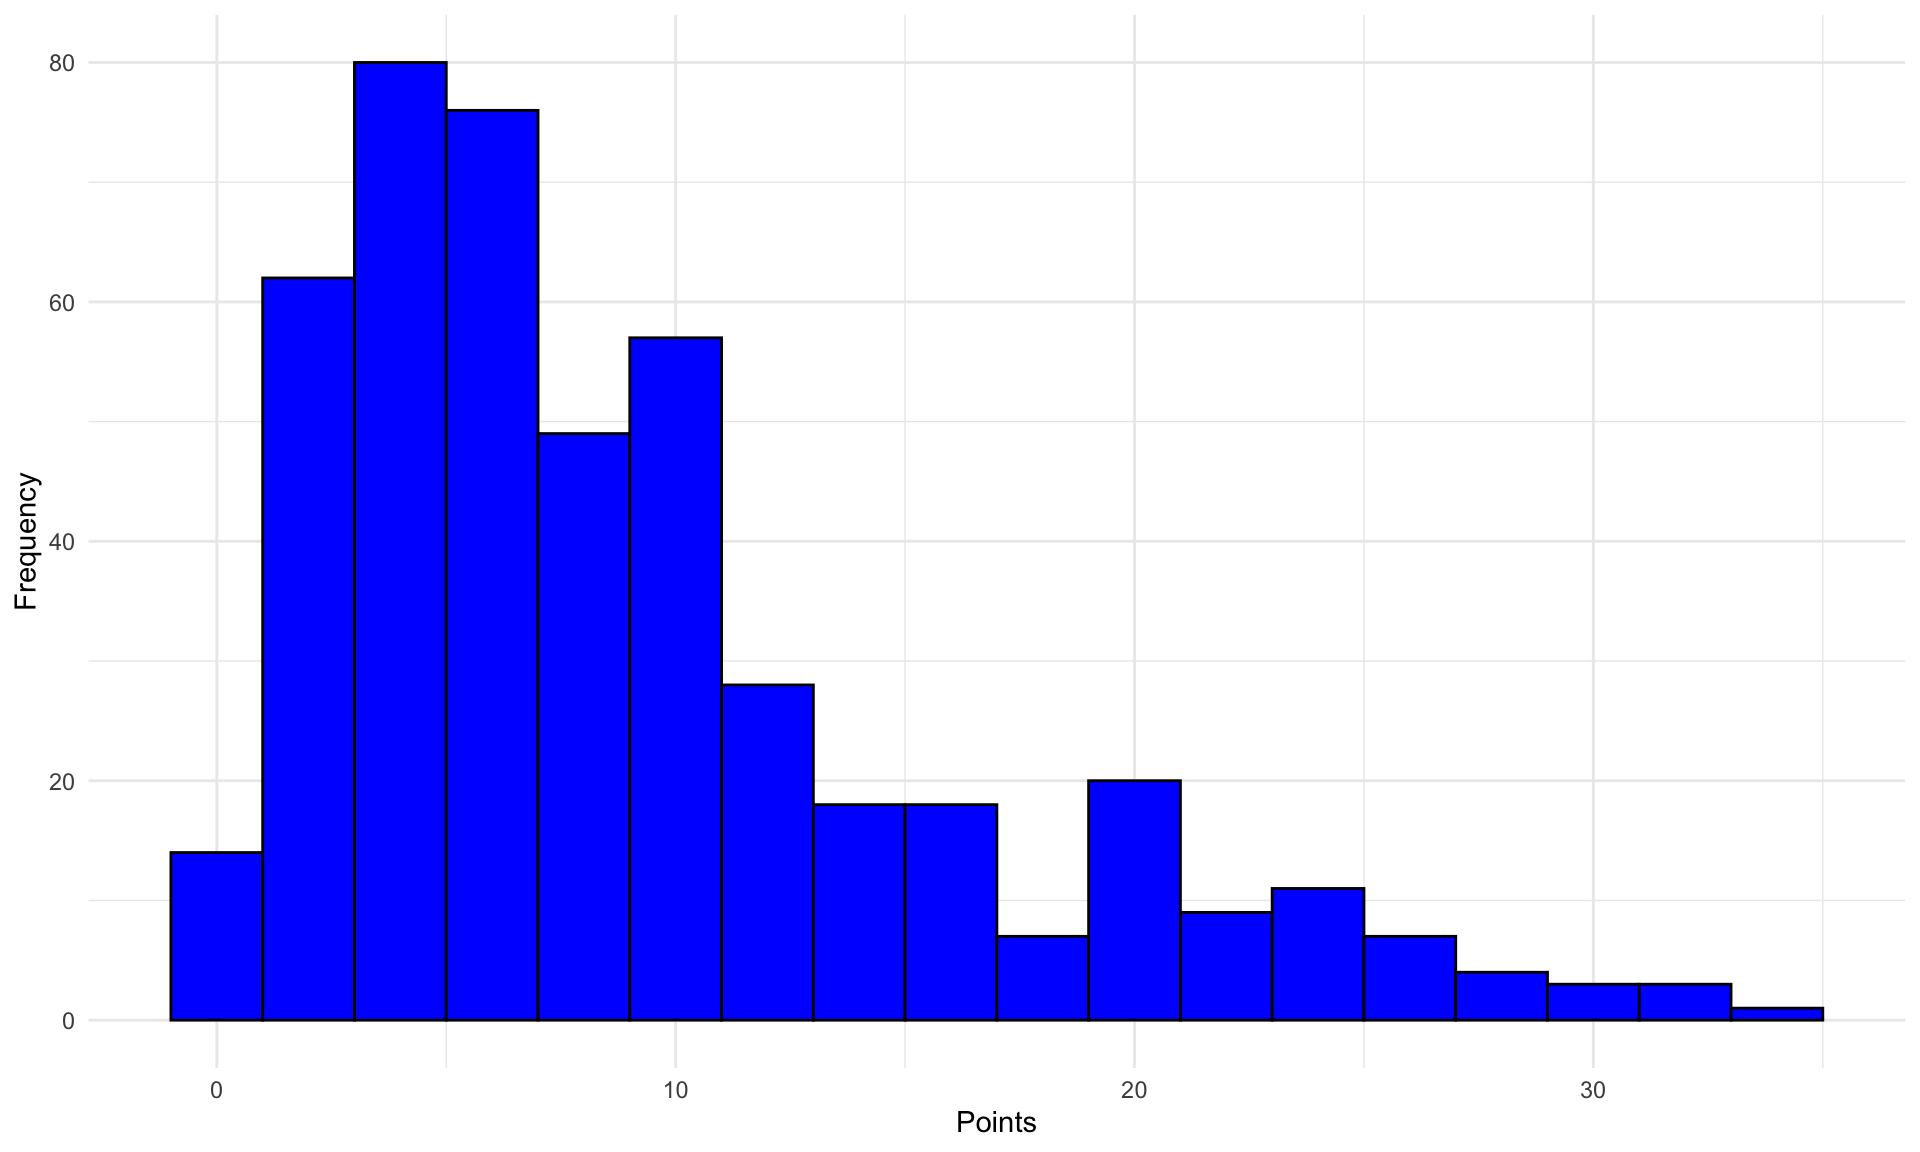
Average Points Per Game
9.13
Average Assists Per Game
2.11
Average Total Rebounds Per Game
3.53
Average FG Percentage
46.5%
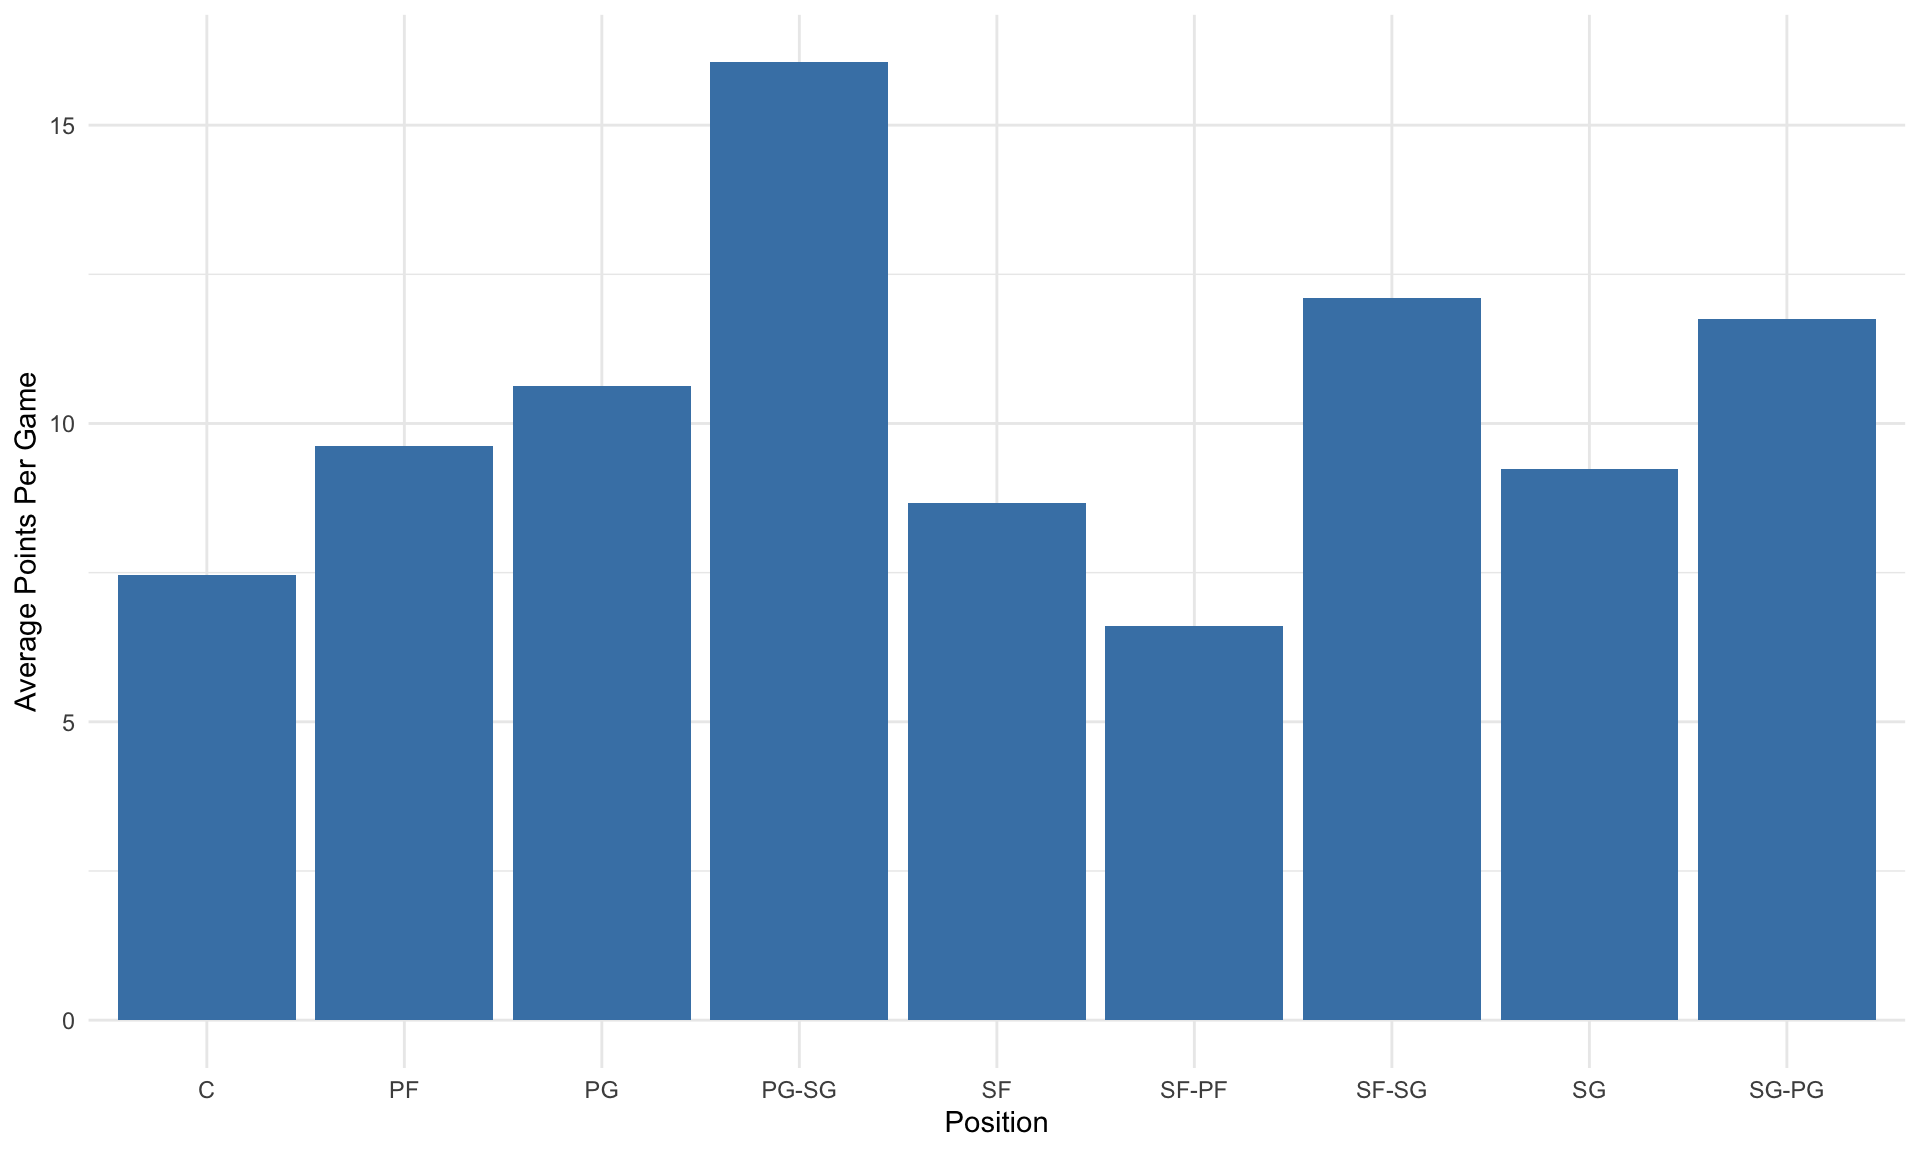
Average Points by Position
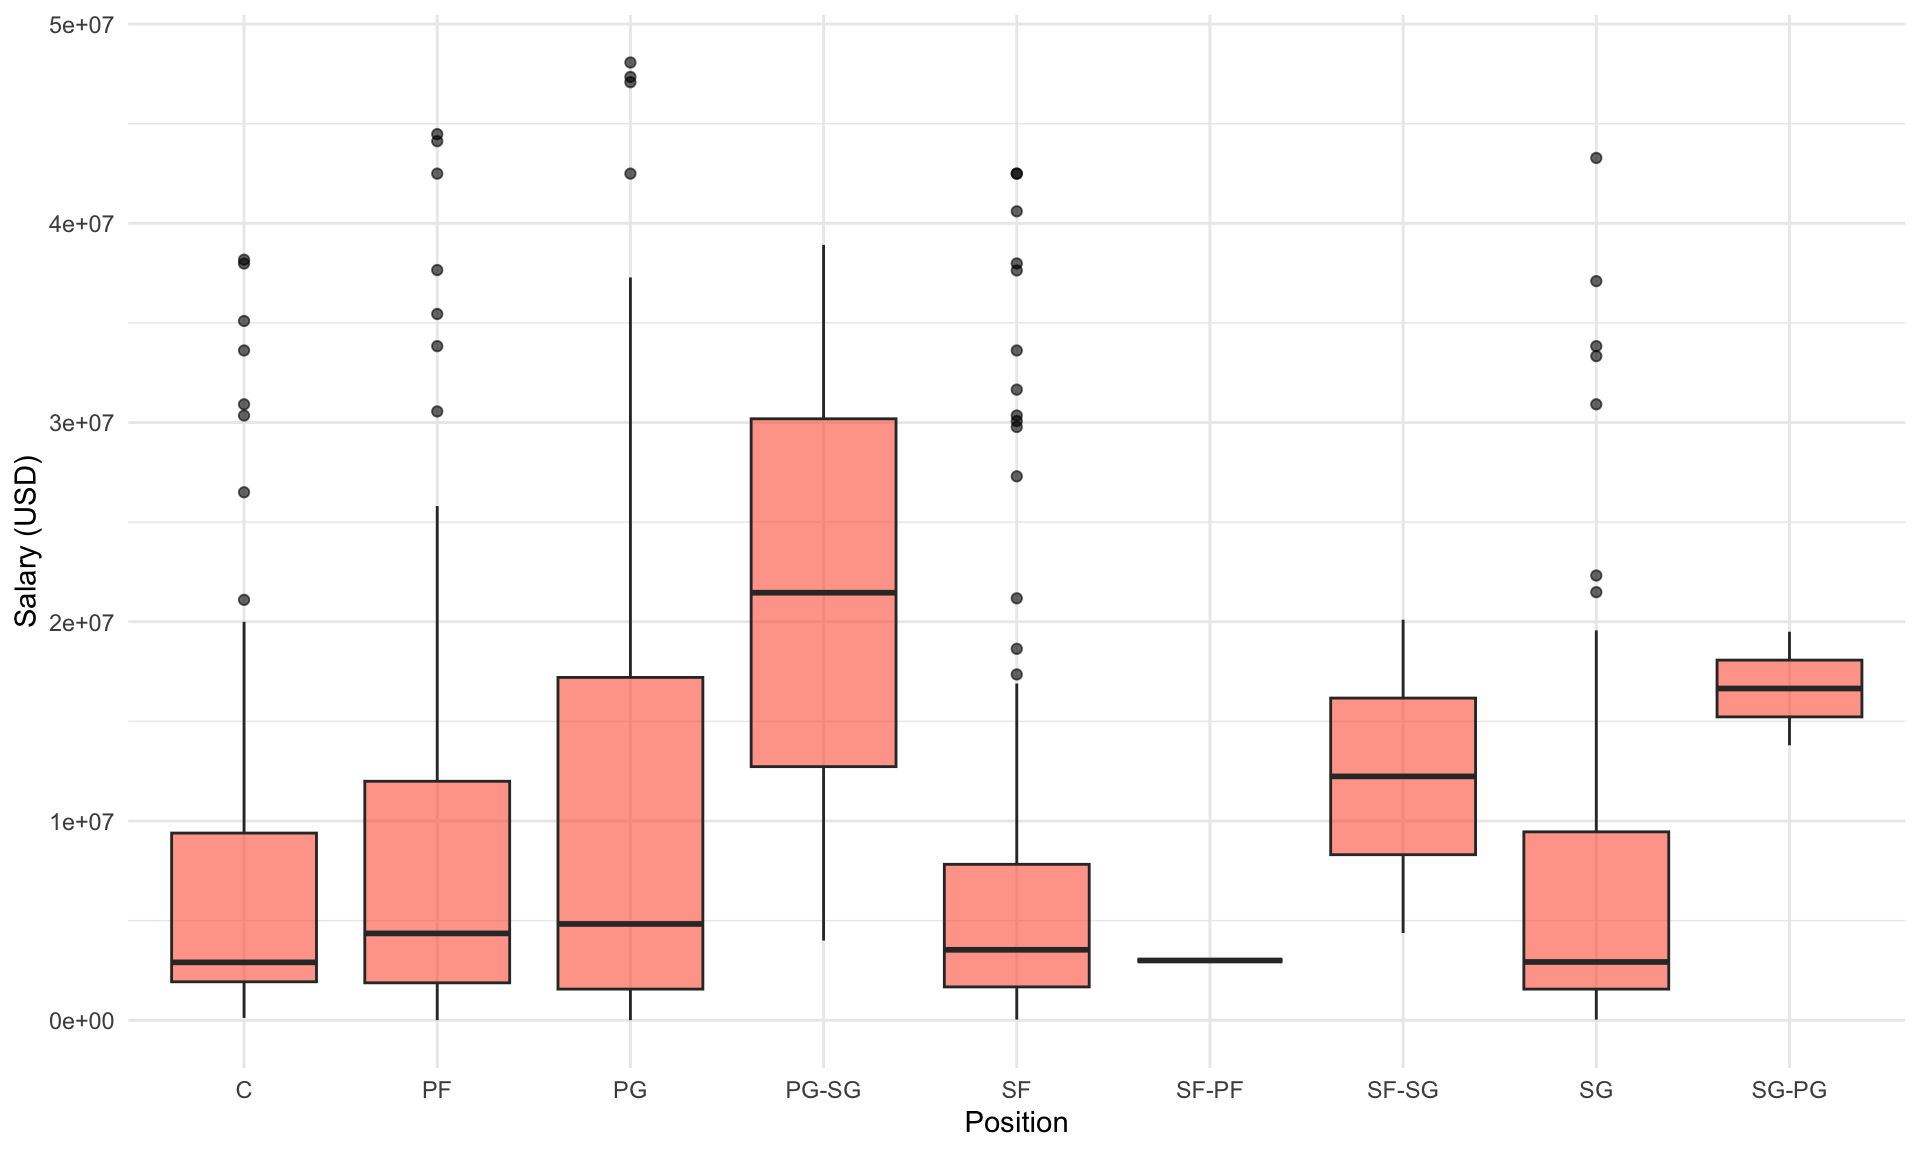
Salary by Position
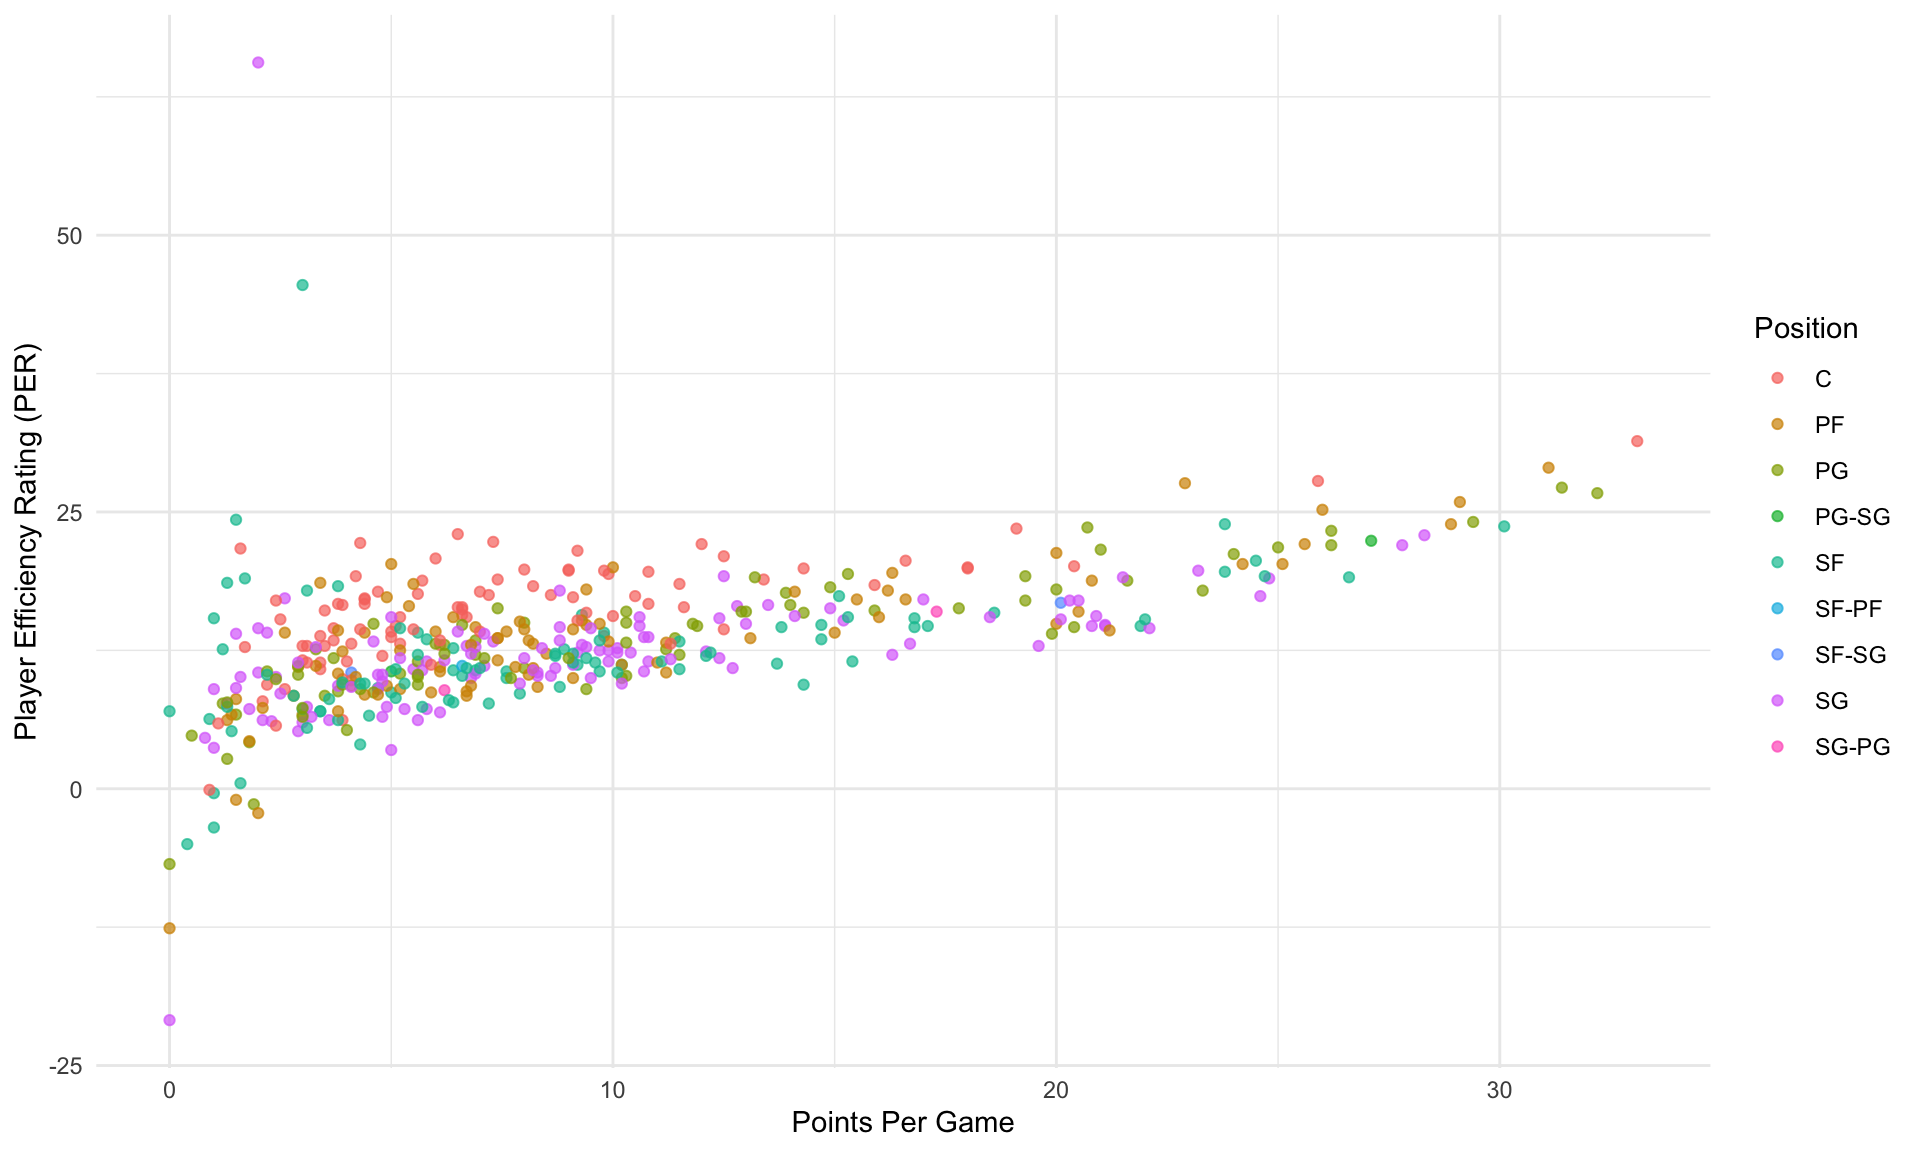
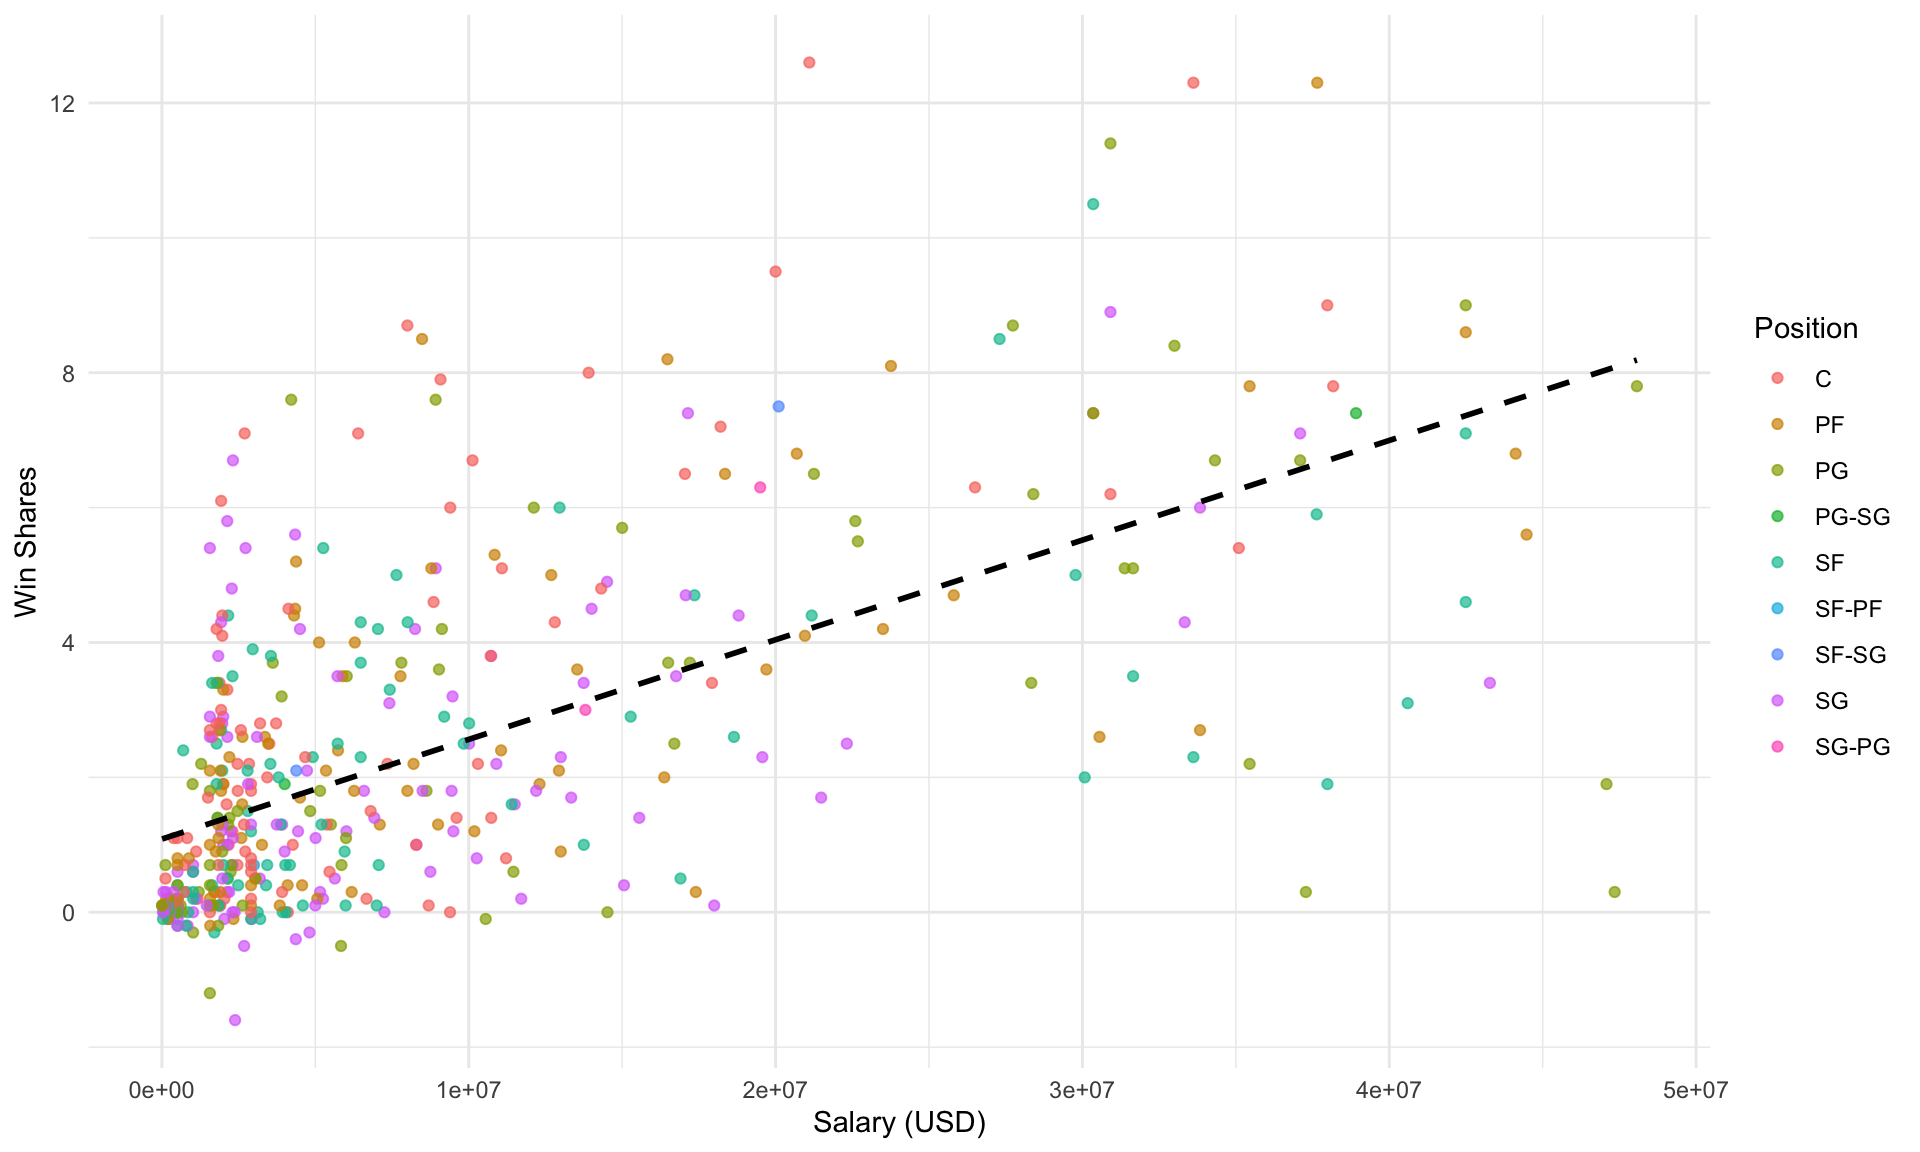
Salary vs. Win Shares
Team-Wise Stats Table
| Team-Wise NBA Statistics | ||||
| Average Points, Assists, Rebounds, and FG% | ||||
| Team | Avg Points | Avg Assists | Avg Rebounds | Avg FG% |
|---|---|---|---|---|
| ATL | 9.1 | 2.0 | 3.8 | 46.7% |
| BOS | 9.2 | 2.1 | 3.9 | 46.5% |
| BRK | 7.6 | 2.4 | 3.5 | 47.9% |
| CHI | 7.9 | 1.7 | 2.7 | 47.3% |
| CHO | 8.7 | 2.1 | 3.6 | 44.5% |
| CLE | 8.8 | 2.0 | 3.2 | 49.2% |
| DAL | 6.0 | 1.1 | 2.4 | 53.1% |
| DEN | 8.6 | 1.9 | 3.3 | 51.8% |
| DET | 8.3 | 2.1 | 3.4 | 43.8% |
| GSW | 10.3 | 2.7 | 3.8 | 47.6% |
| HOU | 7.4 | 1.6 | 2.7 | 40.9% |
| IND | 9.6 | 2.1 | 3.5 | 44.7% |
| LAC | 10.6 | 2.4 | 3.9 | 45.5% |
| LAL | 11.1 | 2.1 | 4.7 | 41.9% |
| MEM | 9.7 | 3.0 | 4.2 | 45.5% |
| MIA | 10.0 | 2.1 | 3.9 | 47% |
| MIL | 10.1 | 2.2 | 4.2 | 45.7% |
| MIN | 9.8 | 2.0 | 3.8 | 49.4% |
| NOP | 11.3 | 2.8 | 3.3 | 46% |
| NYK | 10.3 | 2.0 | 4.2 | 46.6% |
| OKC | 9.9 | 2.1 | 3.8 | 45.7% |
| ORL | 9.1 | 2.0 | 3.5 | 46.4% |
| PHI | 12.7 | 2.8 | 4.0 | 49.9% |
| PHO | 11.2 | 2.9 | 4.3 | 47.1% |
| POR | 10.7 | 2.8 | 3.4 | 45.7% |
| SAC | 7.3 | 1.7 | 2.8 | 45.9% |
| SAS | 8.6 | 2.1 | 3.5 | 46.3% |
| TOR | 9.0 | 2.1 | 3.6 | 44.9% |
| UTA | 9.0 | 1.9 | 3.5 | 45.9% |
| WAS | 7.7 | 2.0 | 3.1 | 46.4% |